3 Ways Microsoft Power BI Elevates Your Data
For businesses looking to get the most out of their data, Microsoft Power BI has been somewhat of a revelation. The ability to take data from every corner of a business and analyze it is fostering better decision making and providing a clearer picture provides a competitive advantage over the competition. Data analysis tools like Microsoft Power BI are not new but with the advancements in business software, like cloud accounting, the adoption rate increases faster every day.
Now if you are still doing your research, looking for advantages and disadvantages in different solutions let me help you out. Here are 3 things you can do with Microsoft Power BI that we think are incredible features that you may not know about.
Faster and Easier Data Dissection
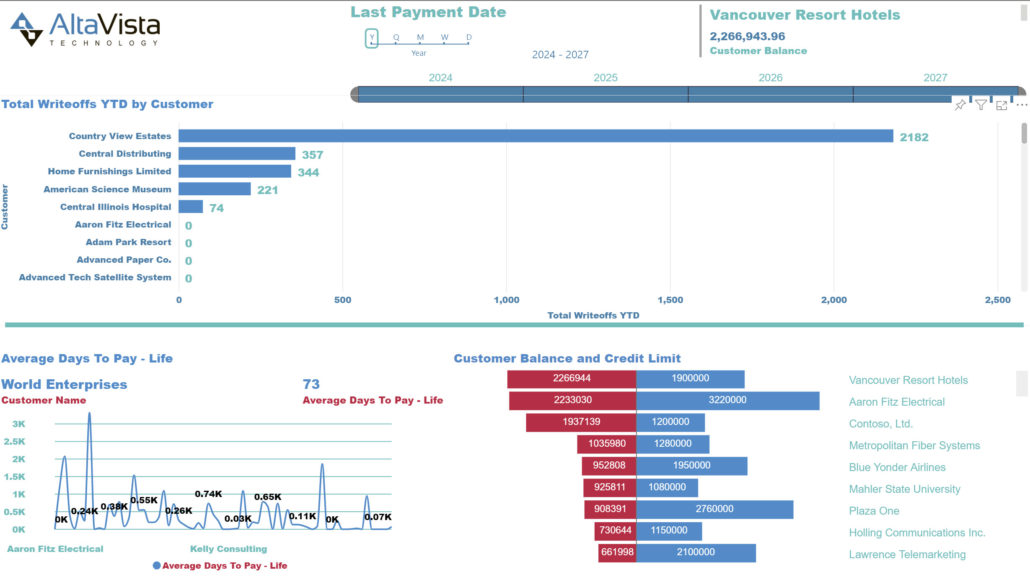
If you have complex Excel files that users touch constantly Power BI may make your job significantly easier. Suppose you want your report readers to be able to look at overall sales metrics, but also highlight performance for individual district managers and different time frames. The ability to create separate reports or comparative charts is built in. You could also add filters in the filters pane to narrow down the scope of your search.

You could also use slicers to filter the data instead of pivot tables. Slicers are another way of filtering. They narrow the portion of the dataset that is shown in the other report visualizations. Slicers and filters make finding specific data sections quick and easy.
Endless Data Sources
Microsoft Power BI has the ability to connect to multiple data sources allowing you to pull data from nearly anywhere. The best part is there is no limit to this. The list of supported sources is vast and if you don’t see your source listed chances are a connection can be built.
This kind of integration allows you a full look at every aspect of your operation. With dataflow in Power BI, you can unify data from multiple sources and prepare that unified data for modeling. This gives you beautiful, filterable graphs and charts in minutes. If you recently migrated systems and want your historical data, no worries! Historical data can be added to current data sets to allow for even deeper comparisons and trend analysis.
Import and Format with Ease
You can even use Power BI to format files. If you spend hours entering individual documents (like invoices) Power BI with Smart Connect can easily perform a mass import. Import the files (XML, CSV, TXT, etc) into Power BI then create an export file and use that file to import the data back into systems like Dynamics GP or Business Central. Something as simple as this can save you hours of hand-keying data.
These are just some of the advantages of business intelligence with data analysis tools like Microsoft Power BI. Another plus is you don’t need to be on a cloud system to get started. If you would like more information on Microsoft Power BI and how you can start to use the piles of data you collect every day to your advantage please reach out to us! Give us a call at 855.913.3228 or send us an email at info@altavistatech.com. You can even fill out our simple web form and someone will reach out to you within one business day. At Alta Vista Technology we take pride in being part of your solution.


