The Top 3 Ways Data Visualization is Changing Business
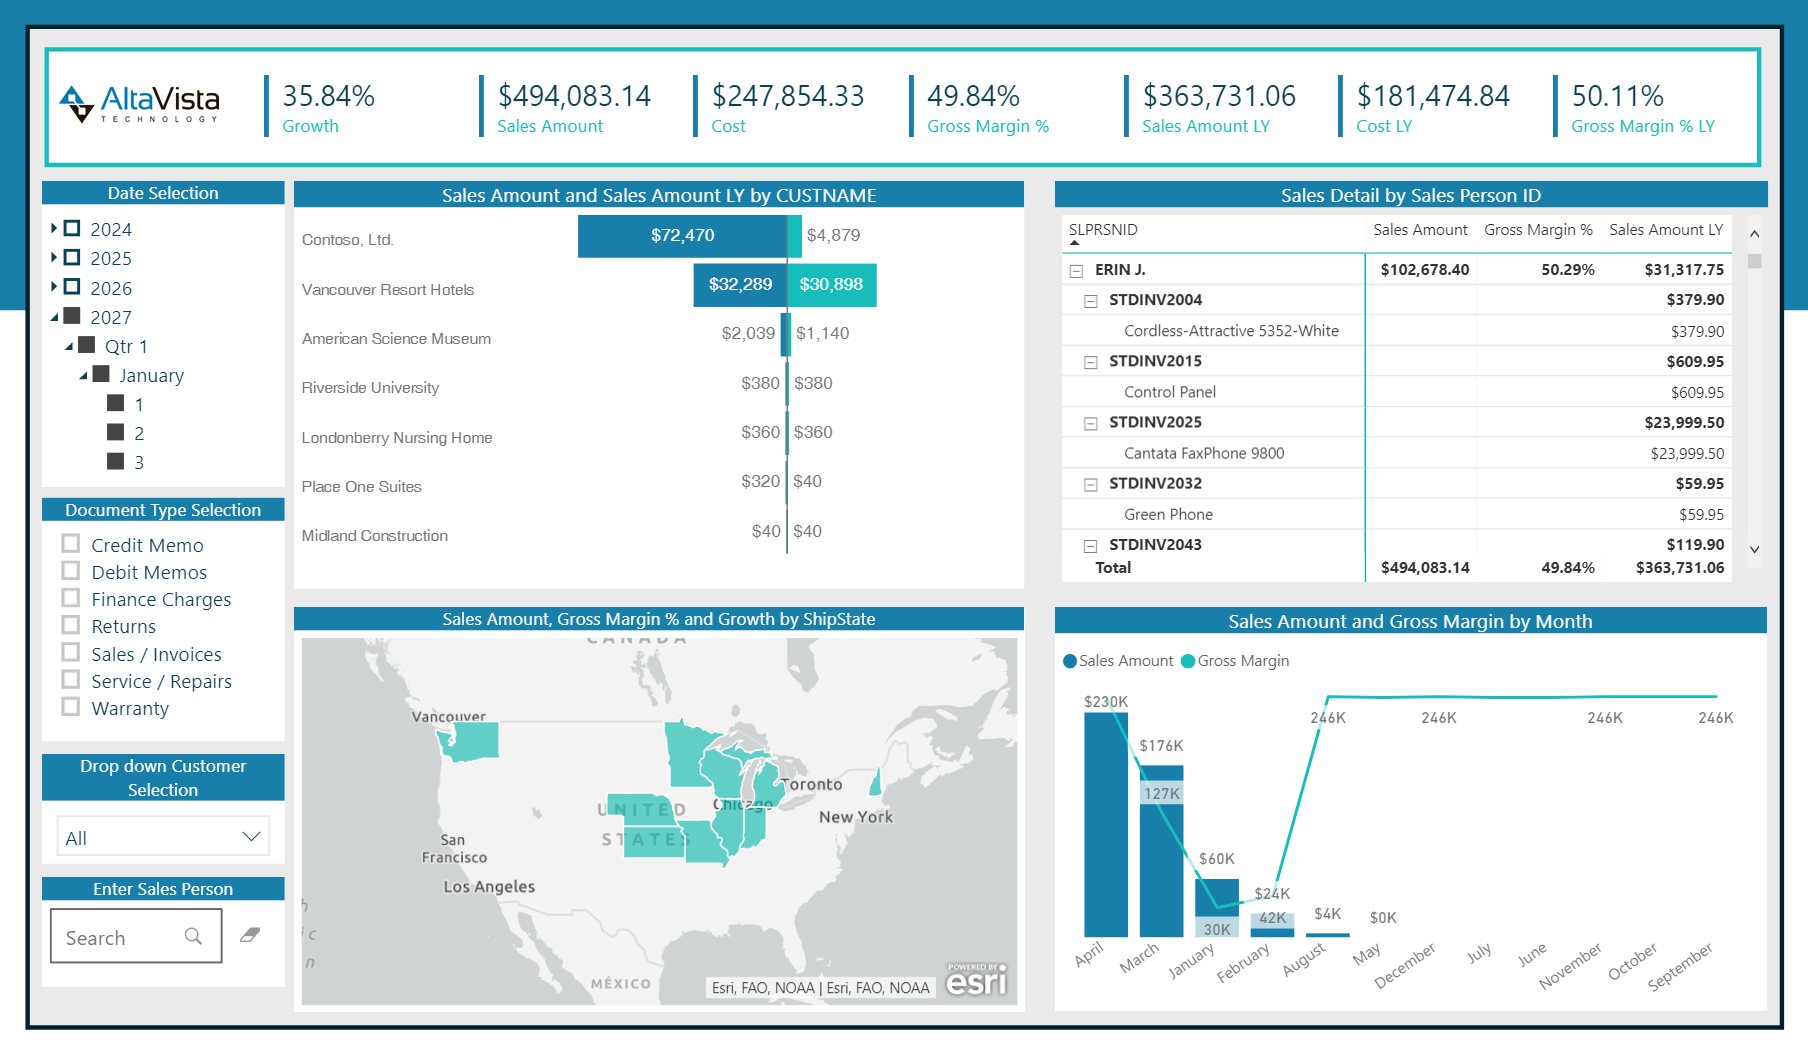
Data visualization is something people use every day, whether they know it or not. The business world is full of bar and line graphs, but why is it so important that almost every business has used them at one point or another? There are several reasons for data visualization software, but we want to hit on the top 3 that are changing how businesses view their data and use it to advance their mission.
Data and the Brain
Let’s take a look at how the brain processes data. Would you rather look at a list of numbers and decipher what it means for yourself, or are you a visual learner? Most people are the latter since it is quick and easy to process information with just a quick glance. Around 65% of the world’s population are visual learners, meaning that graphs and visualized data would be the most effective way to present and analyze data to more than half of the world.

So by presenting data in a visually pleasing way, people are more likely to grasp the message being conveyed, notice trends, and act quickly to respond to them without sifting through cells on a spreadsheet.
A More Efficient Way to Analyze
For most, data visualization software offers an easier and more efficient way to analyze data. For example, a trend would be easier recognized if there was a sudden drop on a line graph – compared to a list of numbers, only noting a drop if looking closely at each individual cell of data. Data visualization also exposes hidden trends and patterns for analysis. For example, if sales were progressing well, but the expenses related to those sales decreased the net profit, you’d quickly notice this trend by seeing the information on a compared line graph rather than spending time matching each individual number on an Excel spreadsheet. This leads us to aesthetics.
Easy on the Eyes
Aesthetics play a significant role in keeping a client’s interest and attentiveness. As stated previously, two out of every three people are visual learners, meaning it would be more likely for a customer to pay greater attention if given a graph rather than a list of numbers, allowing for quicker judgment. Visually appealing graphs and charts help bring forward next-level visualizations in a logical way. The more appealing the visual, the more likely someone viewing it will pay attention and retain the information – which can be essential in closing a deal or gaining a new customer.
Bottom-line, the brain processes pictures and graphs the most efficiently, which is why data visualization software is so relevant in today’s business world. The brain processes, analyzes, and judges data better when it can see the information and trends at a mere glance. It also prefers a chart rather than spending time looking at and analyzing individual cells in an Excel spreadsheet. So, if you are looking for new ways to display and utilize the data you collect every day more effectively, drop us a line at 855.913.3228 or fill out our simple web form. Someone will reach out within one business day to help you discover data visualization with Microsoft PowerBI. At Alta Vista Technology, we take pride in being part of your solution!


